A Technical Case Study in NBN Line Fault Diagnosis for Commercial Premises
Oct 16, 2026
Introduction
Recently, we were engaged by a managed service provider looking after a retail shop in Eaton Fair Shopping Centre, Western Australia, experiencing severe NBN performance issues.
NBN had already attended site and confirmed their network was operating correctly up to the MDF, leaving the fault on the customer's side of the demarcation point.
This is the technical story of how we diagnosed and resolved the issue—complete with diagnostic and test results from both the NBN provider and our own TechTV line analysis equipment.

The Complaint
The client reported the following symptoms:
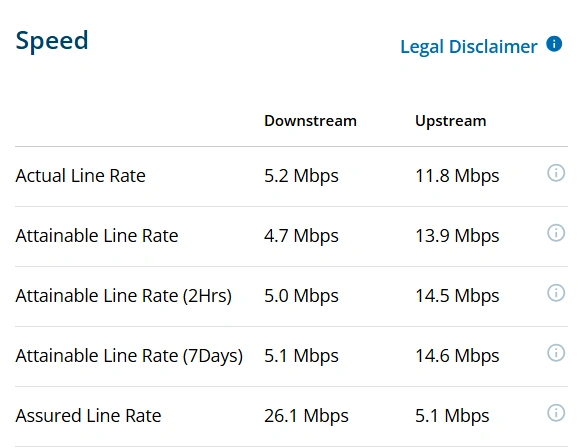
Download speeds of 5-10 Mbps on a plan with an assured line rate of 26Mbps / 5Mbps.
Upload speeds of approximately 15 Mbps—faster than download
Frequent dropouts disrupting EFTPOS transactions and cloud applications
General instability across all connected devices
nbn has already attended and confirmed their end is OK
The asymmetry was the key diagnostic clue. On any VDSL-based NBN connection (FTTN, FTTB), download speeds should always substantially exceed upload speeds. When the inverse occurs, it indicates line impairment—the physical medium is degrading the signal before it reaches the modem.
The TechTV Diagnostic Process
Step 1: Line Health Assessment
We connected a specialised VDSL/PSTN test meter to the line inside the shop's communications rack. This equipment allows us to analyse the electrical characteristics of the copper pair, far beyond what a standard speed test can reveal.
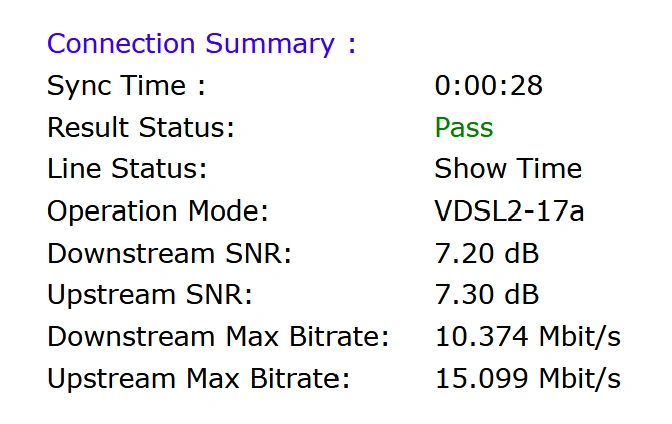
The results speak for themselves! This line is in trouble.....
TechTV's own test results:
Step 2: Hlog Per Bin Analysis
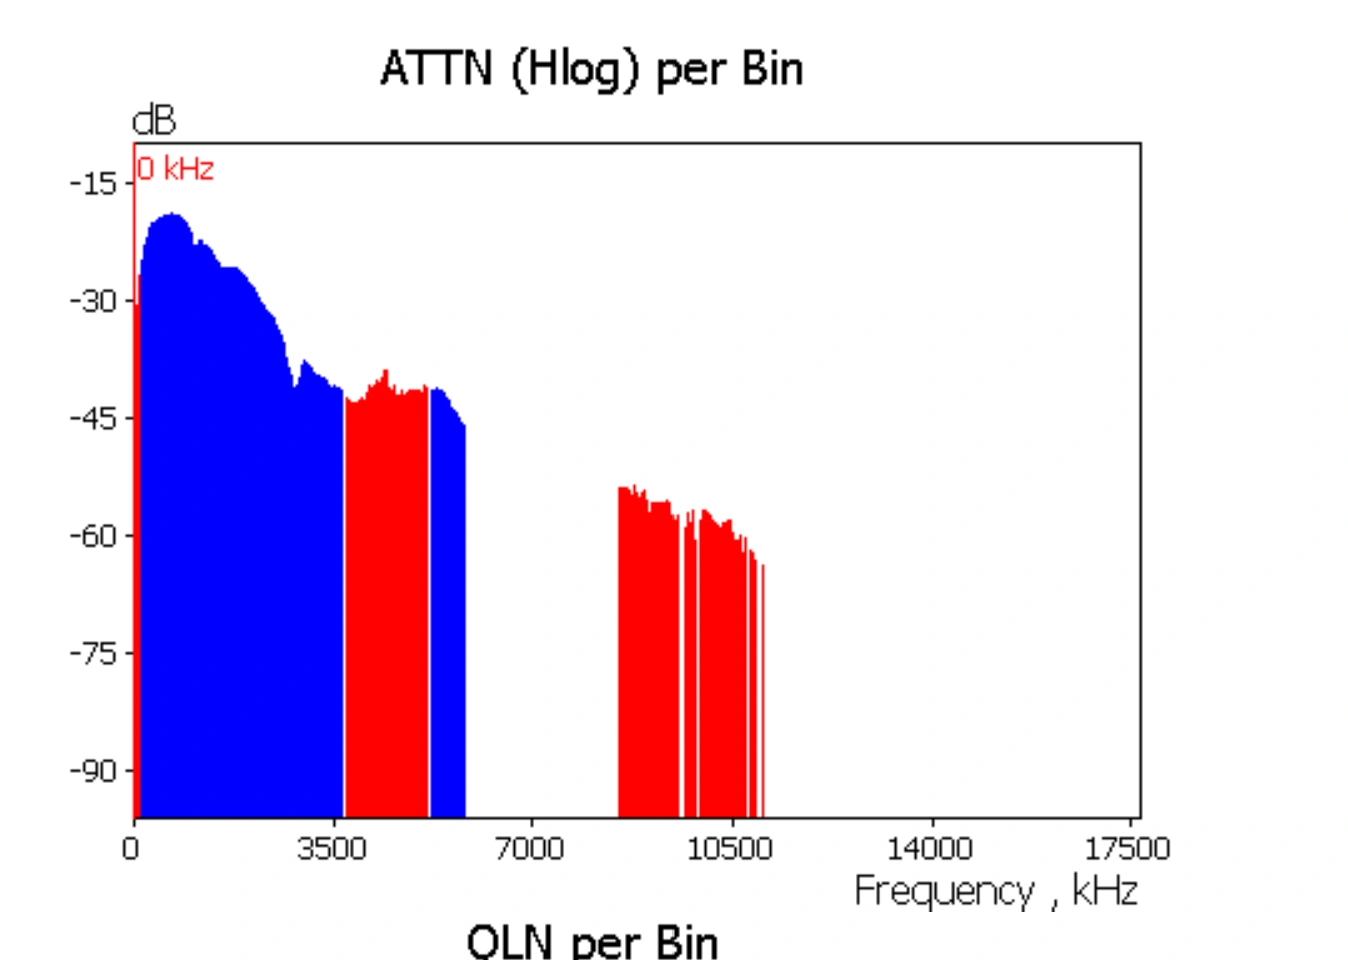
The critical diagnostic tool in this case was the Hlog (Hybrid Log) per bin graph. (Above)
What is Hlog?
Hlog measures the insertion loss (attenuation) of the line across individual subcarriers (bins) used by the VDSL protocol. Each bin represents a narrow frequency band. The graph plots signal loss against frequency.
What a healthy line looks like:
A smooth, gradual, linear curve
Attenuation increases predictably as frequency rises
No sudden dips, spikes, or irregularities
What we observed (Pre-Fix):
The Hlog graph was non-linear and erratic. It displayed significant "suck-outs"—sharp dips in signal strength at specific frequencies—and irregular peaks. This pattern is characteristic of:
Impedance mismatch
Bridge taps
Split pairs
Poor terminations
The line was effectively "leaking" signal at certain frequencies, forcing the modem to reduce its sync rate to maintain stability. Scroll down to see the Hlog Per Bin graph after we were finished.
The Root Cause: A Split Pair on a 10-Pair Cable
We traced the cabling from the MDF (Main Distribution Frame) through to the commercial premises' IDF (Intermediate Distribution Frame) then to the communications rack. The building was wired with a 10-pair copper cable—standard for commercial installations where multiple services may be required. Something was wrong with the wire lengths.
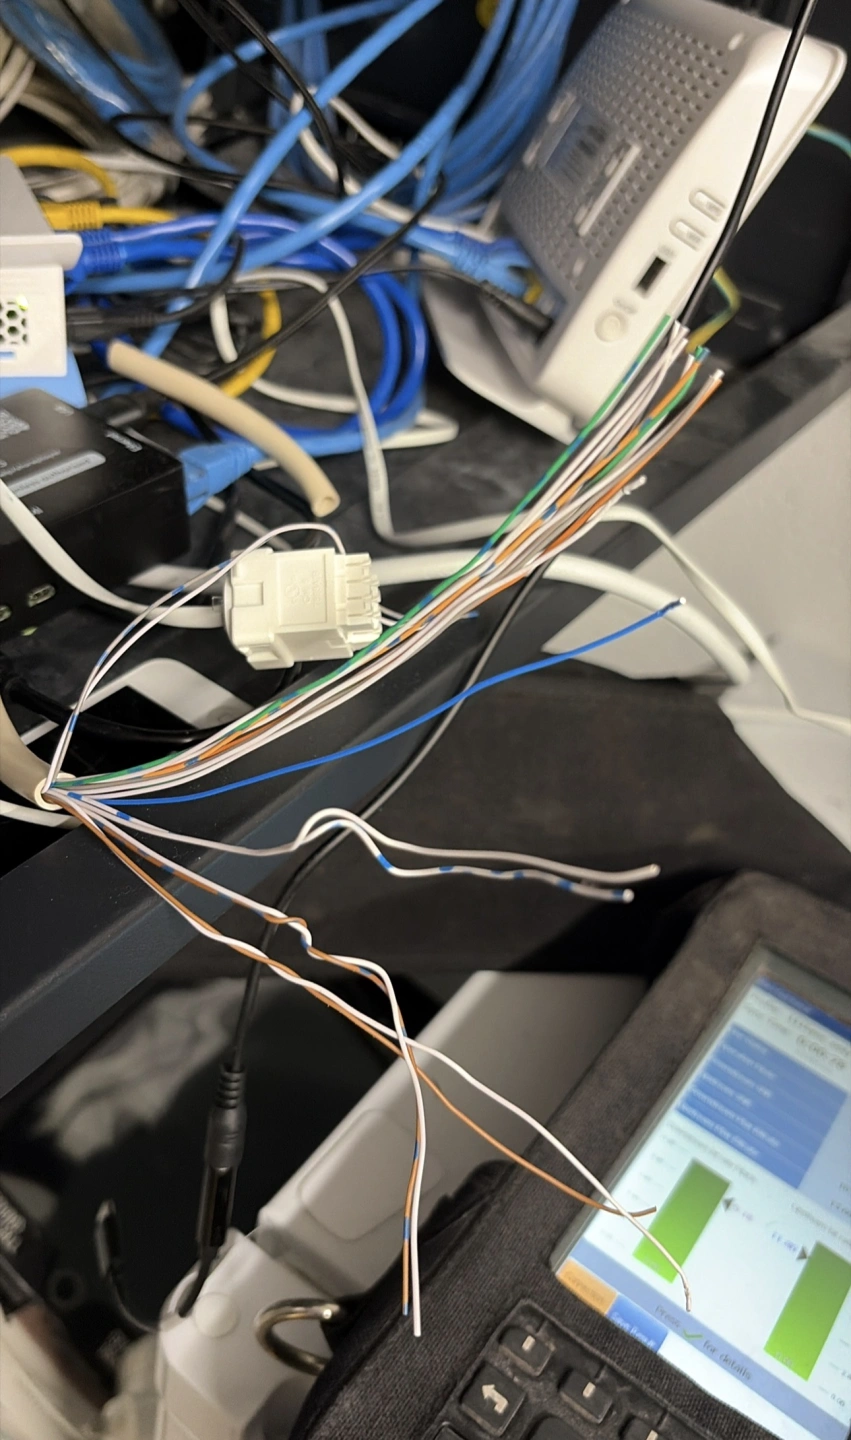
Upon inspection of the terminations, we identified the fault: a split pair. This required us to cut and strip back the incoming 10-pair cable to identify the correct wires.
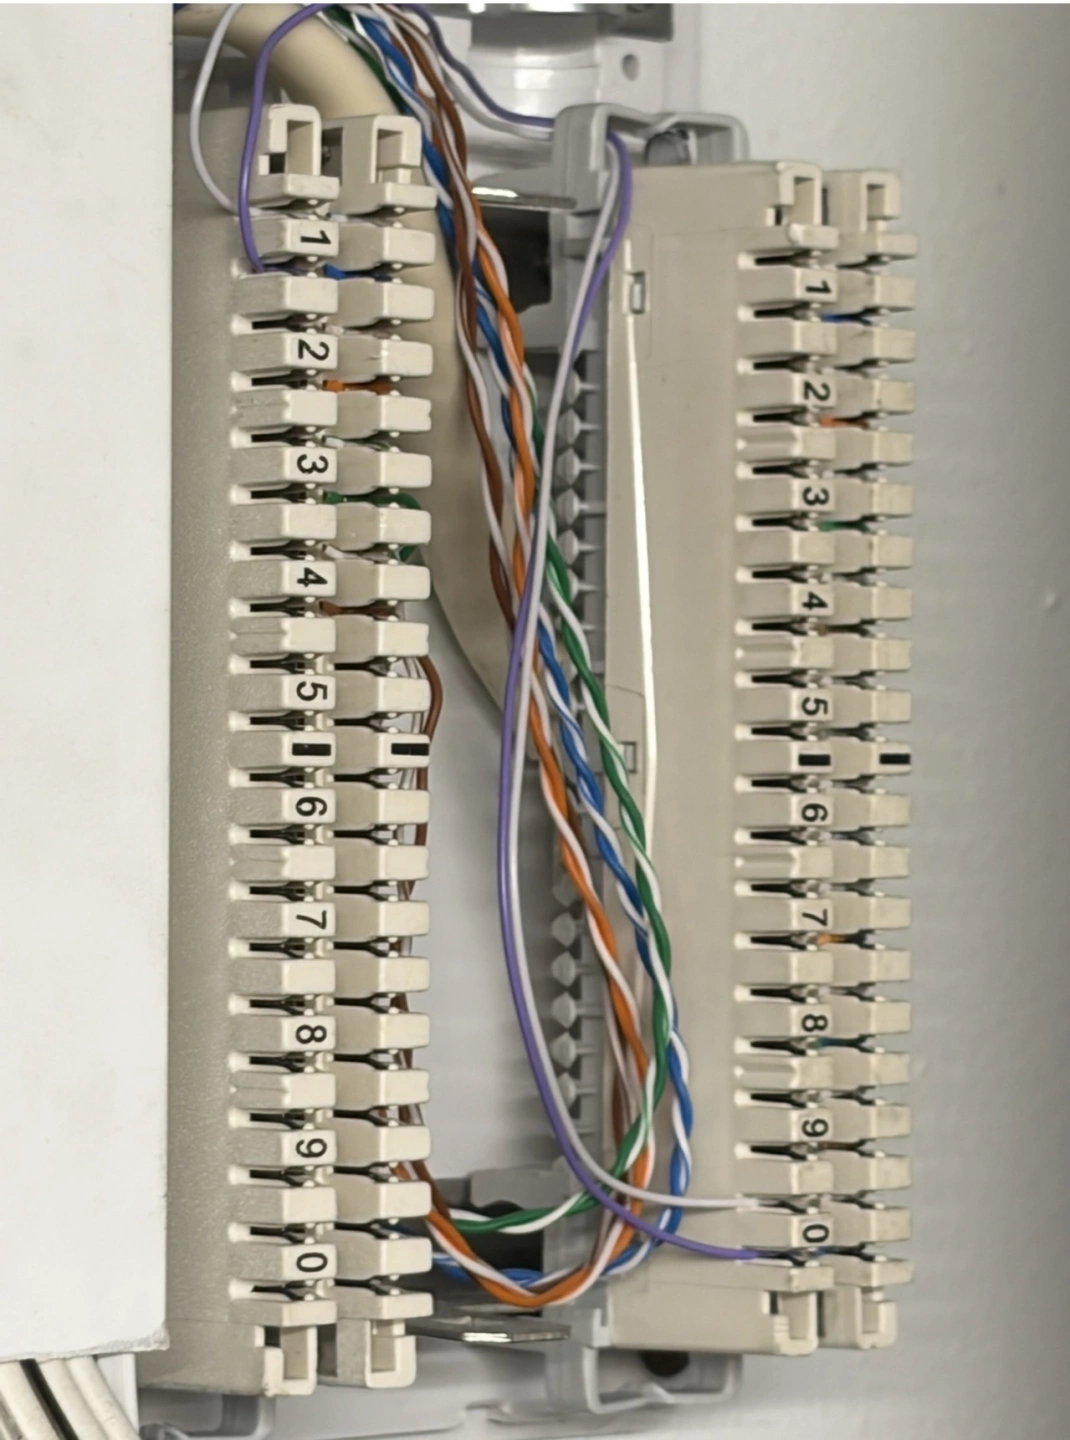
Performing testing after cutting the main cable and stripping it back:
What Is a Split Pair?
In twisted pair cabling, data is transmitted across two wires that are twisted together. The twist in telephone cable above is very subtle compared to ethernet cabling - so it is possible to split the pairs especially if you are inexperienced. Check the photo above to see
Provides common-mode rejection of external electromagnetic interference
Maintains balanced transmission across the pair
Prevents crosstalk between adjacent pairs
A split pair occurs when the termination incorrectly pairs wires from two different twisted pairs. For example:
Correct PairingSplit Pair (Fault)Pair 1: Blue / White-BlueBlue (Pair 1) / Orange (Pair 2)Pair 2: Orange / White-OrangeWhite-Blue (Pair 1) / White-Orange (Pair 2)
When pairs are split, the benefits of twisting are lost. The result is:
Severe impedance mismatch
Increased crosstalk
Signal reflection
Unbalanced transmission
This perfectly explained the non-linear Hlog graph and the degraded sync rates.
It's funny with the bad reputation FTTN has, that it can still work with just a single wire connected.
The Results
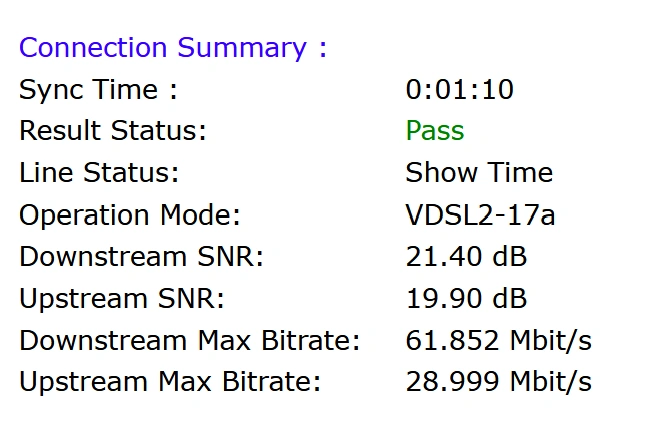
Hlog Per Bin Graph (Post-Fix)
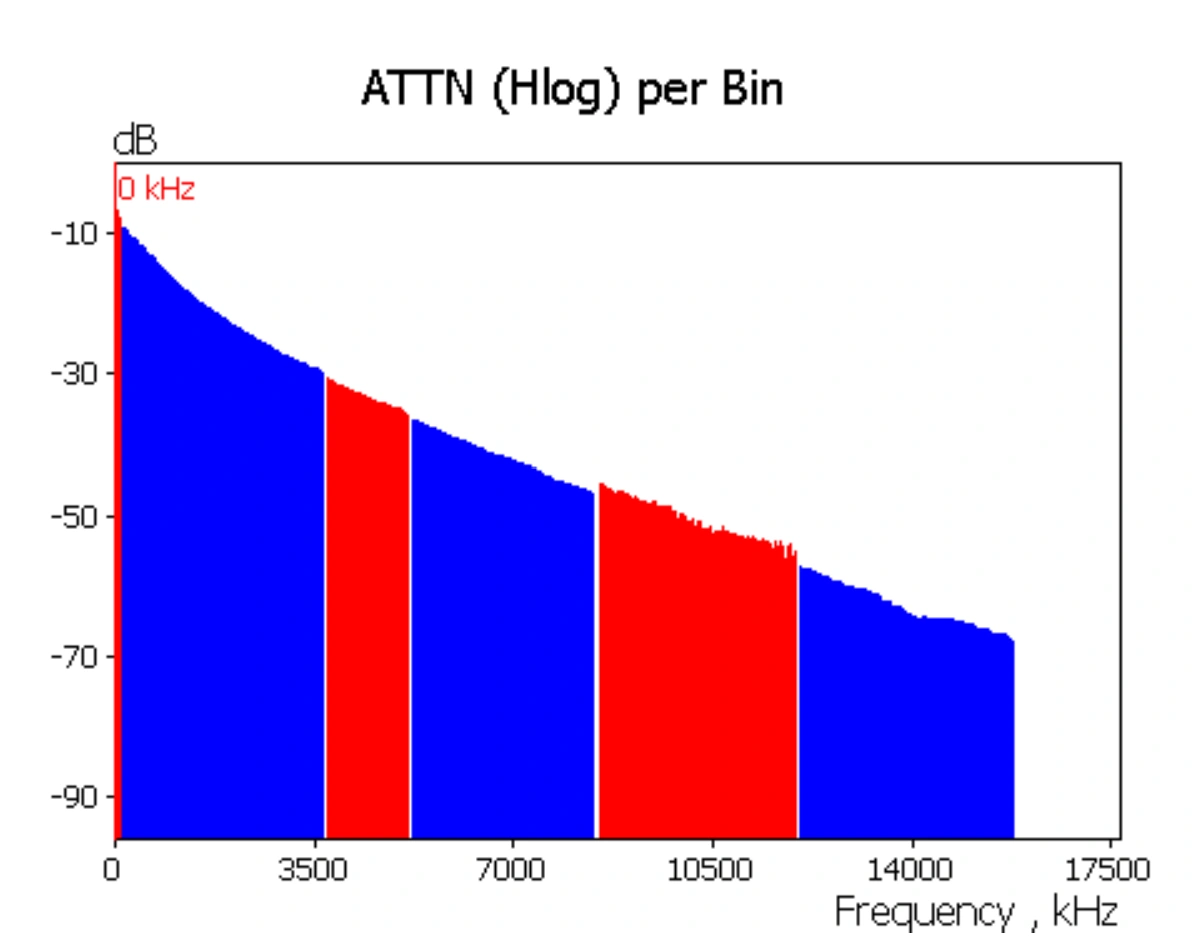
The transformation was immediate and definitive. The graph shifted from a jagged, erratic pattern to a clean, linear curve. This indicated:
Correct impedance matching
No bridge taps or reflections
A healthy, balanced transmission line
The line is working as fast as it can, given the 500 metre distance to the node that we measured.
TechTV has been resolving complex NBN line faults for businesses and managed service providers across Perth, WA since 2015. If you need a specialist who can find what others miss, contact us at office@techtv.au.
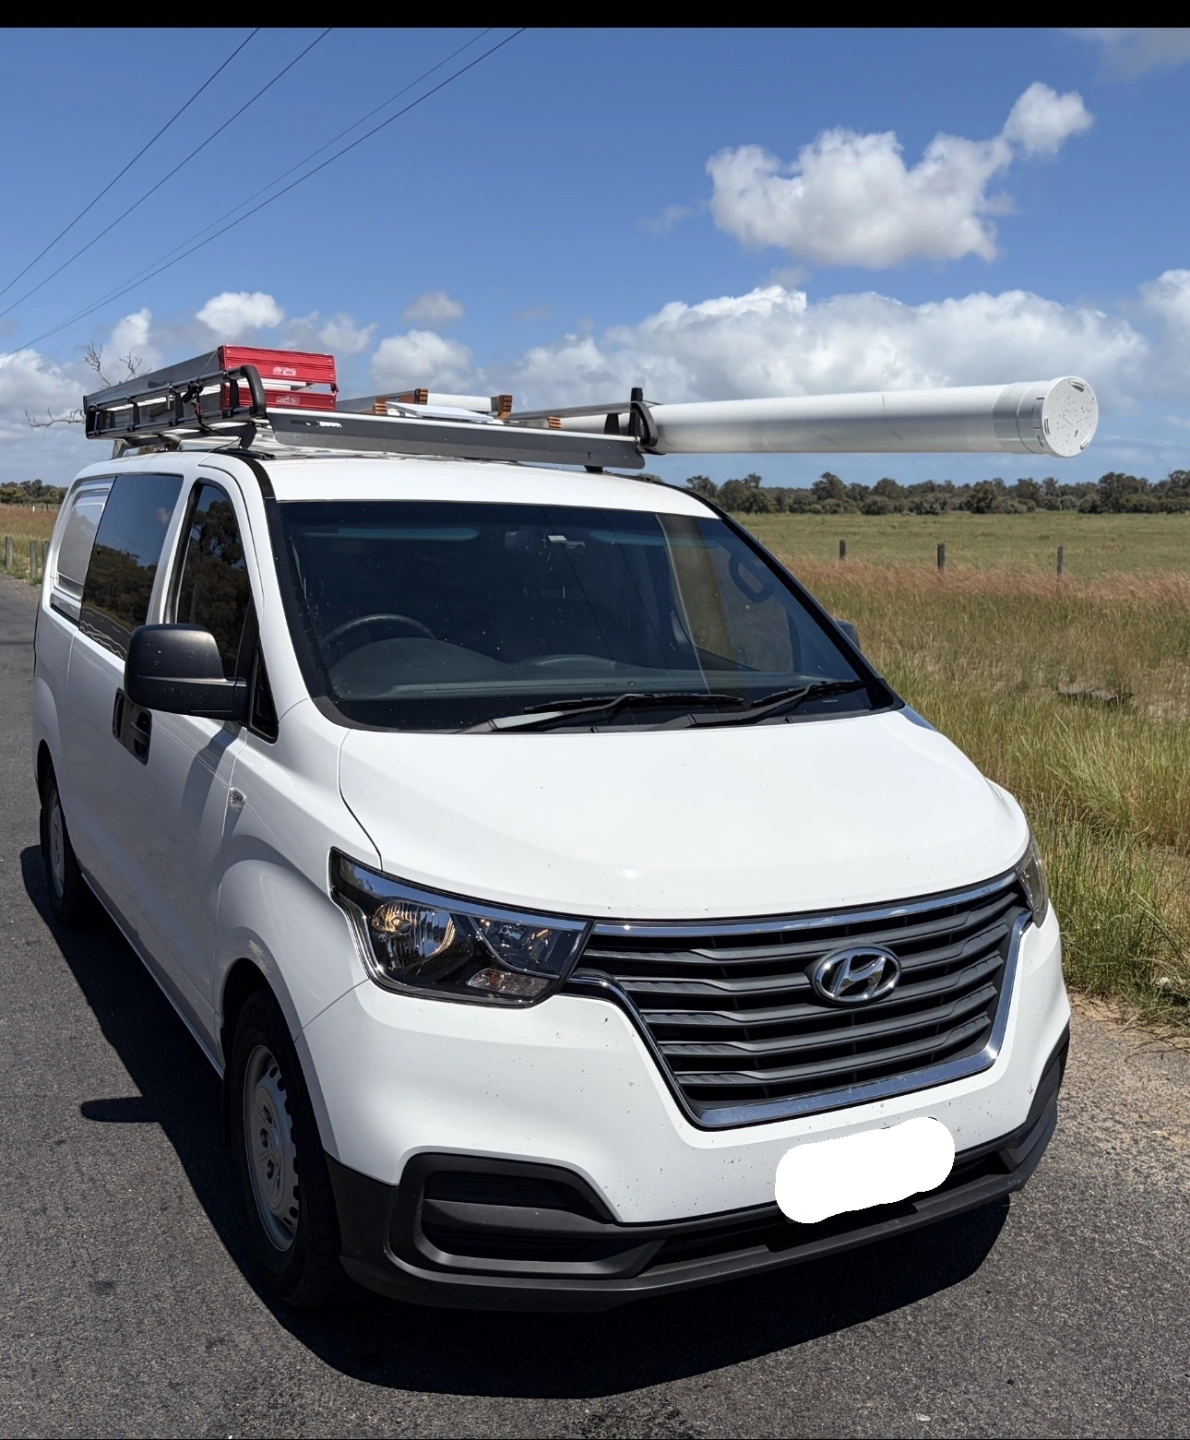
TechTV's fully equipped work van on the way back to Perth after fixing the fault described above: